The Stockpulse Method
Our message collectors trace Social Media squawk in English, German, and Mandarin. We collect our data from several thousand different sources worldwide. This user-generated content comprises a substantial part of communication in Social Media networks today. We identify this emotionally expressed content and classify it as “Emotional Data.”
Data intelligence refers to the collection of large amounts of data called data mining. Both parts of Social Media analysis are unstructured and must be processed to create value for financial investors. Stockpulse’s artificial intelligence filters this bulk of information, selects, structures, and converts it into intelligible data for the financial industry. The outcome is Emotional Data Intelligence!
Able to understand the emotions expressed by market participants, investors improve their asset allocation and enhance seeking alpha.
We present the results of our “Key Events Classifier” at a glance!
Results for the English Data Set
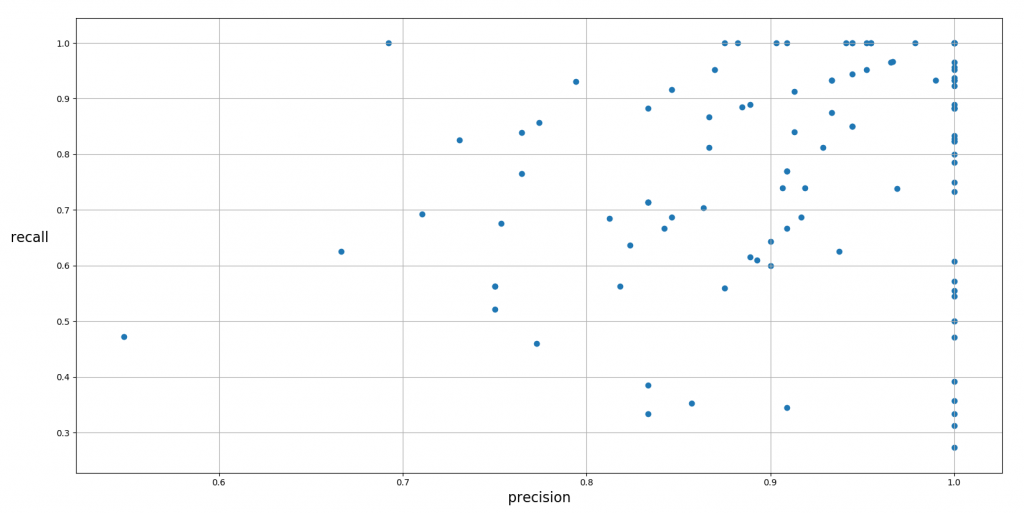
In total there are 2,019 messages and 3,030 event labels in these messages in the labeled English data set. The overall value for “precision” is 0.88 and the value for “recall” is 0.78. The below figure shows the precision and recall of every event. Each point represents an event. Most events have precision values of over 0.80.
Results for the Chinese Data Set
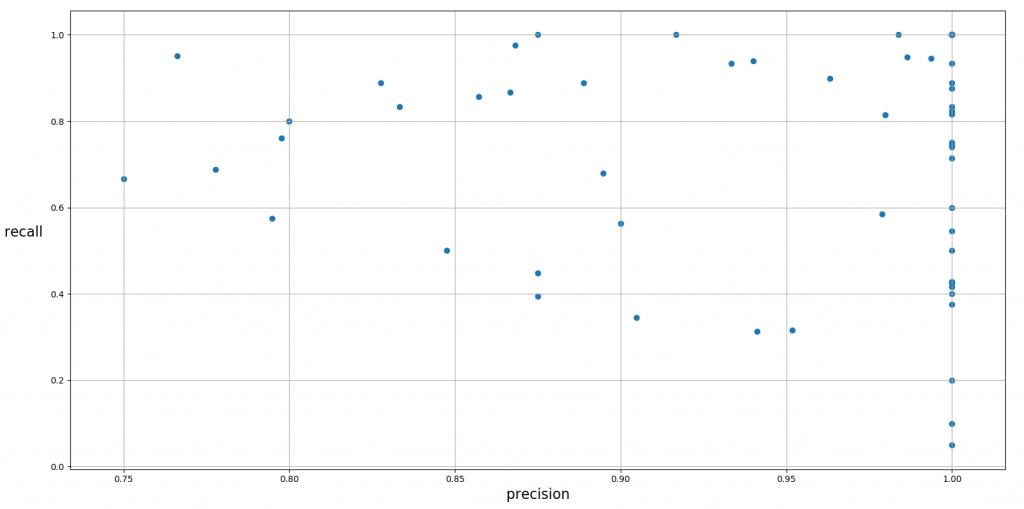
Using the same process from the Chinese data set, there are 2,326 messages and 3,128 event labels. The entire precision is 0.86 and the recall is 0.66. The figure below also presents the precision and recall of events for Mandarin.
Result Analysis
Based on the evaluation performance, our Key Events Classifier is able to detect 123 events. These events belong to 17 categories: Corporate Restructuring, Drug Approval, Bankruptcy, Earnings, Analyst Report, Insider Transaction, Exploration, Dividend, Accident, Regulatory, Credit Rating, Equity Action, Legal, Security, Products, Labor Issues and Disease Outbreak, etc.
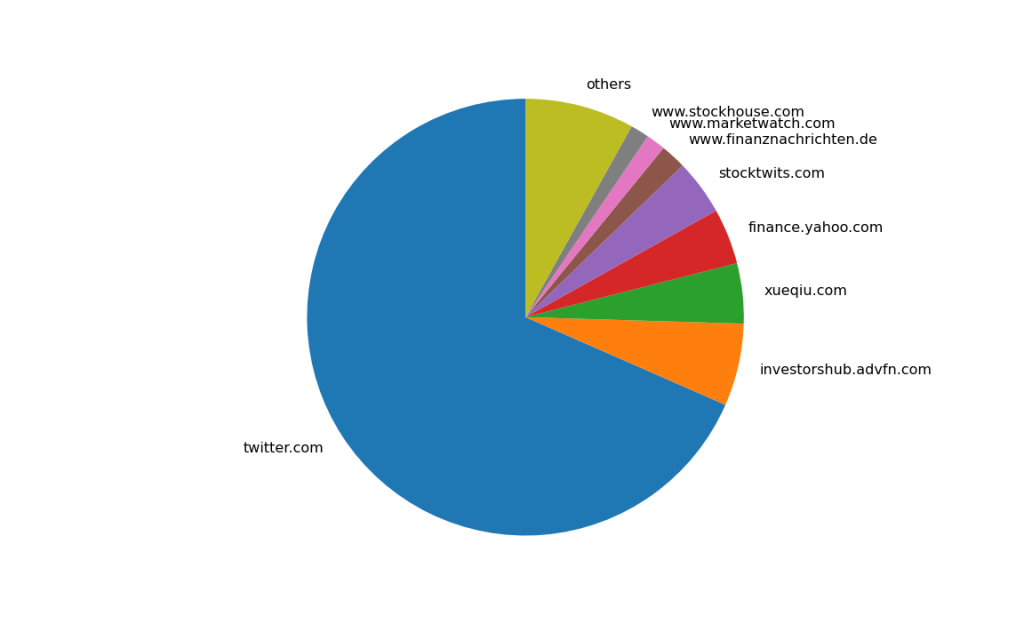
We run the classifier through our entire historical data we collected for the past decade and obtain around 27 million labels. The pie chart below indicates which social media channels we use to collect the data.
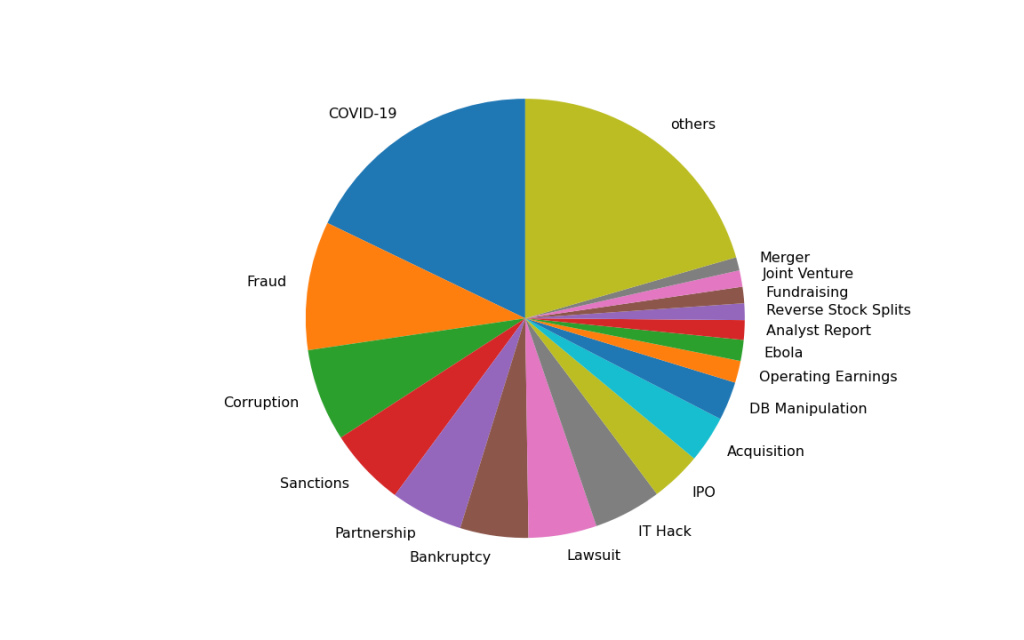
We also survey these labels by events as well. The following pie chart displays the distribution of events in these labels.
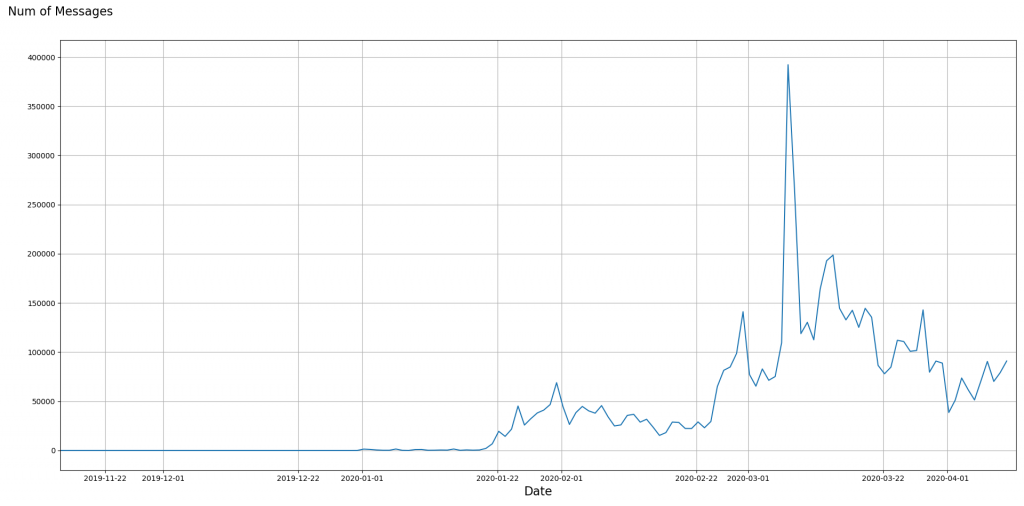
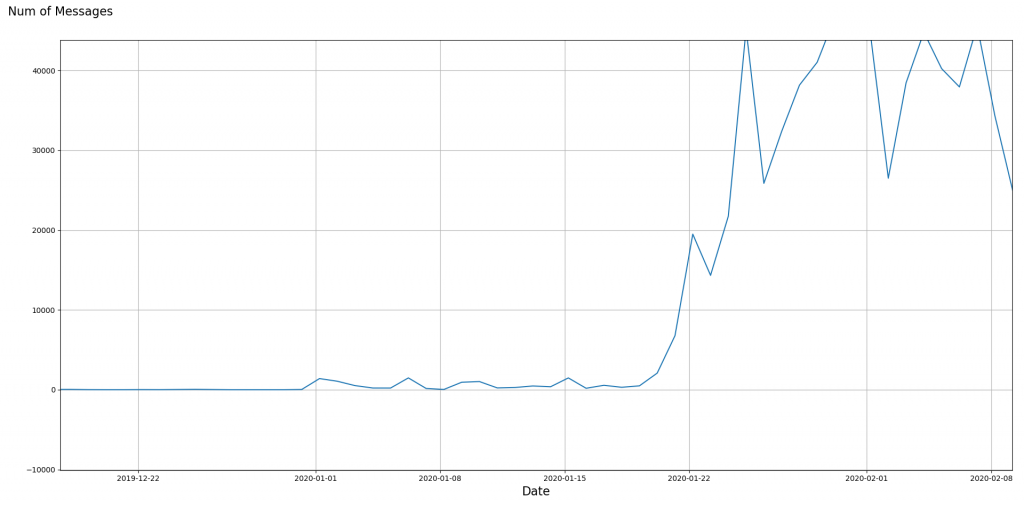
We analyze the timeline of the global pandemic (COVID-19) based on our data. In the next two figures, the curve slightly fluctuates in the beginning of January, which is the moment of the disease outbreak in China.
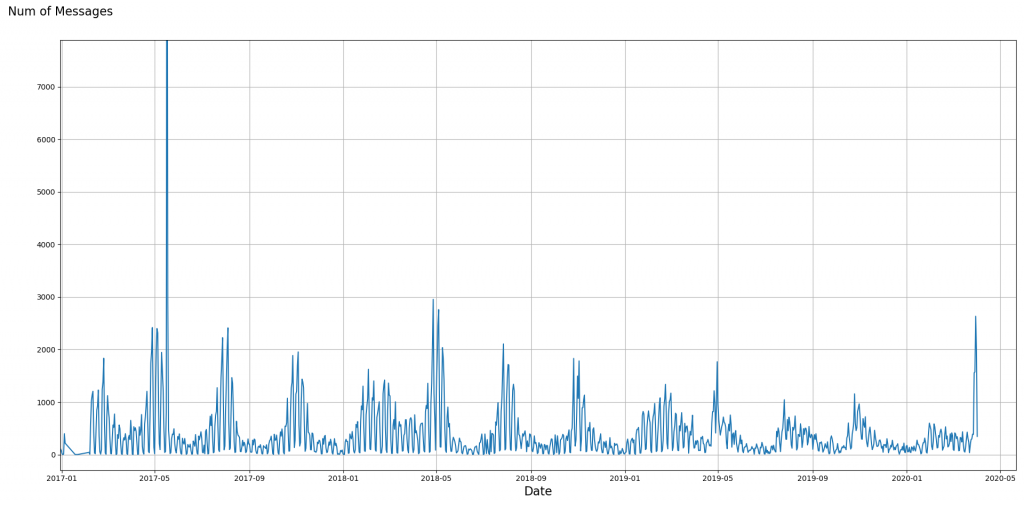
In addition, in the event of releasing earnings, we also detect a regular pattern of fluctuation. Number of related messages raises in February, May, August and October, matching to periods of releasing earnings by companies.
Our Key Events Classifier is able to detect early signs of significant key events that might have a significant impact on the development of financial markets.